Candlestick patterns are graphical representations of price movements of a financial asset over a period of time. They are widely used by traders and investors to analyze the market sentiment and identify potential trading opportunities. In this post, we will introduce you to the basics of candlestick patterns, explain how to read them, and show you some of the most common and useful ones.
What are candlesticks?
A candlestick is a single unit of information that shows the open, high, low, and close prices of an asset for a specific time interval. The time interval can range from minutes to months, depending on the chart settings. A candlestick consists of two parts: a body and a shadow (or wick).

The body is the rectangular part that shows the difference between the open and close prices. The color of the body indicates whether the asset closed higher or lower than it opened. A green (or white) body means that the asset closed higher than it opened, indicating bullish pressure. A red (or black) body means that the asset closed lower than it opened, indicating bearish pressure.
The shadow is the thin line that extends from the body to show the highest and lowest prices reached during the time interval. The upper shadow shows the high price, while the lower shadow shows the low price. The length of the shadows indicates the volatility and uncertainty in the market. Long shadows mean that there was a lot of price fluctuation, while short shadows mean that there was little price movement.

How to read candlestick patterns?
Candlestick patterns are formed by one or more candlesticks that have a specific shape and meaning. They can provide clues about the past, present, and future behavior of the market participants and the direction of the price trend. Candlestick patterns can be classified into three categories: reversal, continuation, and indecision.

Reversal patterns signal that the current trend is likely to change direction. They usually occur at the end of an uptrend or a downtrend, indicating that the buyers or sellers are losing momentum and control. Some examples of reversal patterns are hammer, shooting star, engulfing, harami, dark cloud cover, piercing pattern, morning star, and evening star.

Continuation patterns signal that the current trend is likely to resume after a brief pause or consolidation. They usually occur during an uptrend or a downtrend, indicating that the buyers or sellers are still dominant and confident. Some examples of continuation patterns are marubozu, spinning top, doji, rising three methods, falling three methods, three white soldiers, and three black crows.

Indecision patterns signal that the market is in a state of balance or uncertainty, with no clear direction or conviction. They usually occur during a sideways or range-bound market, indicating that the buyers and sellers are equally matched and waiting for a catalyst or a breakout. Some examples of indecision patterns are spinning top, doji, high wave candle, long legged doji, gravestone doji, and dragonfly doji.

What are some common and useful candlestick patterns?
Here are some of the most common and useful candlestick patterns that you should know as a beginner:

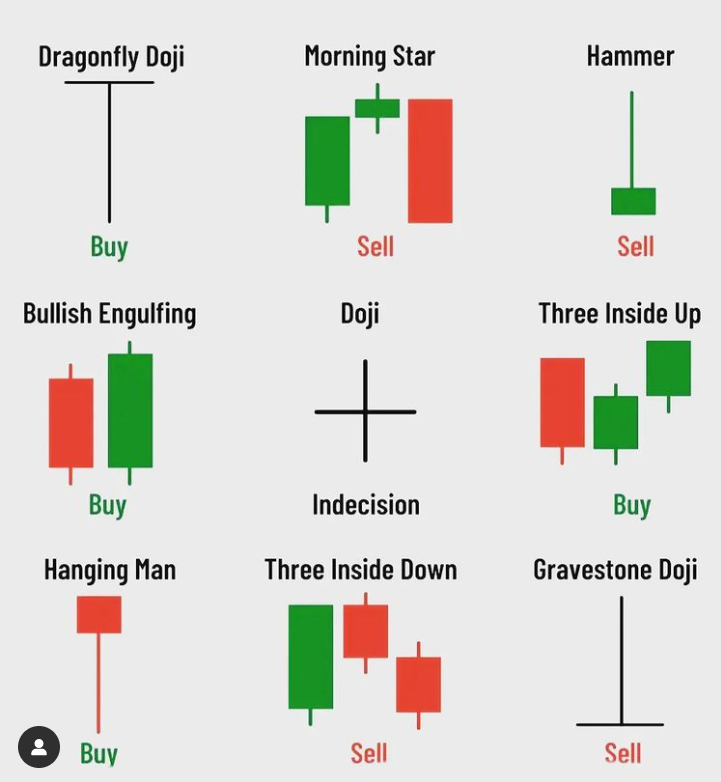
- Hammer: A bullish reversal pattern that forms in a downtrend. It has a small green body with a long lower shadow and little or no upper shadow. It indicates that the sellers pushed the price lower but failed to sustain it as the buyers stepped in and drove the price higher.
- Shooting Star: A bearish reversal pattern that forms in an uptrend. It has a small red body with a long upper shadow and little or no lower shadow. It indicates that the buyers pushed the price higher but failed to maintain it as the sellers stepped in and drove the price lower.
- Bullish Engulfing: A bullish reversal pattern that consists of two candlesticks: a small red one followed by a large green one that completely engulfs it. It indicates that the sellers were in control but lost it to the buyers who took over with strong force.
- Bearish Engulfing: A bearish reversal pattern that consists of two candlesticks: a small green one followed by a large red one that completely engulfs it. It indicates that the buyers were in control but lost it to the sellers who took over with strong force.
- Bullish Harami: A bullish reversal pattern that consists of two candlesticks: a large red one followed by a small green one that is contained within it. It indicates that the selling pressure is weakening and a potential reversal is possible.
- Bearish Harami: A bearish reversal pattern that consists of two candlesticks: a large green one followed by a small red one that is contained within it. It indicates that the buying pressure is weakening and a potential reversal is possible.
- Dark Cloud Cover: A bearish reversal pattern that consists of two candlesticks: a large green one followed by a red one that opens above its high and closes below its midpoint. It indicates that the buyers are losing confidence and the sellers are gaining strength.
- Piercing Pattern: A bullish reversal pattern that consists of two candlesticks: a large red one followed by a green one that opens below its low and closes above its midpoint. It indicates that the sellers are losing confidence and the buyers are gaining strength.
- Morning Star: A bullish reversal pattern that consists of three candlesticks: a large red one, a small one of any color with a gap below it, and a large green one with a gap above it. It indicates that the downtrend is ending and a new uptrend is beginning.
- Evening Star: A bearish reversal pattern that consists of three candlesticks: a large green one, a small one of any color with a gap above it, and a large red one with a gap below it. It indicates that the uptrend is ending and a new downtrend is beginning.
Candlestick Patterns PDF
candlestick-trading-bible
How to use candlestick patterns in trading?
Candlestick patterns can help you identify trading opportunities by providing visual cues about the market sentiment and the price action. However, they are not enough to make trading decisions on their own. You should always use them in conjunction with other technical tools and indicators, such as trend lines, support and resistance levels, moving averages, oscillators, and volume.
Here are some general tips on how to use candlestick patterns in trading:
- Look for candlestick patterns that confirm the direction of the prevailing trend or signal a reversal of it.
- Pay attention to the size, shape, color, and location of the candlestick patterns in relation to the previous ones and the overall chart context.
- Wait for confirmation from the next candlestick or another indicator before entering or exiting a trade based on a candlestick pattern.
- Use stop-loss orders and risk management techniques to protect your capital and limit your losses in case the market moves against you.